Program gto_comparative_map
The gto_comparative_map creates a visualization for comparative maps.
For help type:
./gto_comparative_map -h
In the following subsections, we explain the input and output paramters.
Input parameters
The gto_comparative_map program needs an input file with the plot positions, respecting a defined structure.
The attribution is given according to:
			  			Usage: ./gto_comparative_map [options] [[--] args]
or: ./gto_comparative_map [options]

It creates a visualization for comparative maps.

-h, --help            Show this help message and exit

Basic options
                Contigs filename with positions (.pos),

Optional

-h                    Give this help,
-V                    Display version number,
-v                    Verbose mode (more information),
-l              Link type between maps [0;4],
-w             Chromosome width,
-s             Space between chromosomes,
-m              Color id multiplication factor,
-b             Color id beggining,
-c           Minimum block size to consider,
-i                    Do NOT show inversion maps,
-r                    Do NOT show regular maps,
-o              Output image filename with map,

Example: ./gto_comparative_map -o map.svg map.config
%The input file needs to have the following structure:
%todo
An example of such an input file is:
			  			#SCF    5000000 5000000
aaa     1       1000000 1       1000000 bbbb    3000000 4000000 3000000 4000000
bbb     1500000 2000000 1500000 2000000 cccc    1500000 2000000 1500000 2000000
aaa     2000000 3000000 2000000 3000000 bbbb    3000000 2000000 3000000 2000000
Output
The output of the gto_comparative_map program is a executing report, and a svg plot with the maps.
Using the input above, an output example for this is the following:
			  			==[ PROCESSING ]====================
Printing plot ...
Found 2 regular regions.
Found 1 inverted regions.
Done!

==[ STATISTICS ]====================
Total cpu time: 0 second(s).
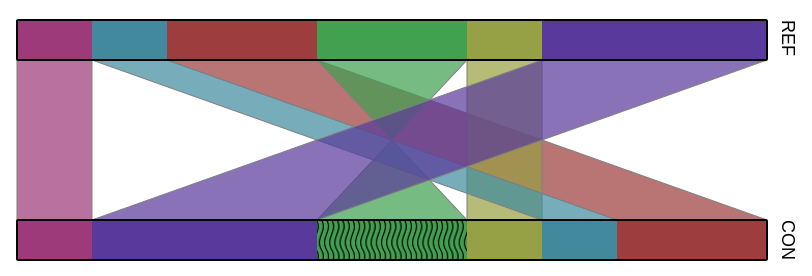
In the Figure is represented the plot for the execution above.