Program gto_genomic_period
The gto_genomic_period calculates the best order depth of a sequence, using FCMs. It only works "ACGT", while the rest will be discarded.
This application has a dependency to represent the results. It requires the Gnuplot to show the execution result.
For help type:
./gto_genomic_period -h
In the following subsections, we explain the input and output paramters.
Input parameters
The gto_genomic_period program needs two streams for the computation, namely the input and output standard. The input stream is a sequence file.
The attribution is given according to:
			  			Usage: ./gto_genomic_period [options] [[--] args]
or: ./gto_genomic_period [options]

It calculates the best order depth of a sequence, using FCMs.It only works "ACGT",
while the rest will be discarded.

-h, --help        show this help message and exit

Basic options
< input.seq       Input sequence file format (stdin)
> output          Output is given by log_2(4)*K(x)/|x|) (stdout)

Example: ./gto_genomic_period < input.seq > output
An example of such an input file is:
			  			TCTTTACTCGCGCGTTGGAGAAATACAATAGTGCGGCTCTGTCTCCTTATGAAGTCAACAATTTCGCTGGGACTTGCGGC
TCTTTACTCGCGCGTTGGAGAAATACAATAGTGCGGCTCTGTCTCCTTATGAAGTCAACAATTTCGCTGGGACTTGCGGC
GACTTCATCGTGGTCTCTGTCATTATGCGCTCCAACGCATAACTTTGCGCCAGAAGATAGATAGAATGGTGTAAGAAACT
GTAATATATATAATGAACTTCGGCGAGTCTGTGGAGTTTTTGTTGCATTAGAGAGCCAAGAGGTCGGACGTCCTCACGTA
GCCCGAGACGGGCAGGGCGATGGCGACTGAACGGGCTCCATATCACTTTGAGCTTTTATGCTTTCGACTCCTCCAGGAGC
TGAACAACCTTGTTCCCGGCAAAGCCCACTGCGTCATGGAGCTCACGGTCTACATTCATGACTGACTAACCGTAAACTGC
Output
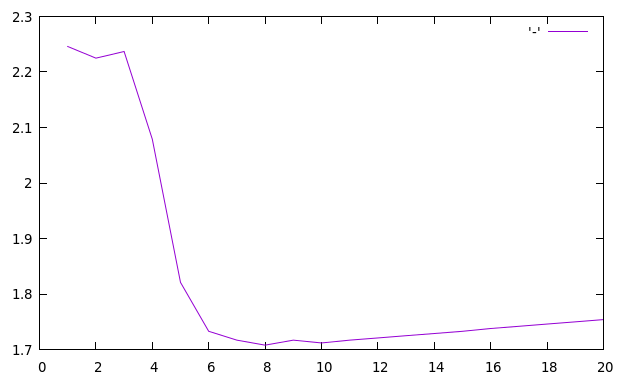
The output of the gto_genomic_period program is a execution report, followed by the plot with this information.
Using the input above, an report example for this is the following:
			  			Running order: 1 ... Done!
Running order: 2 ... Done!
Running order: 3 ... Done!
Running order: 4 ... Done!
Running order: 5 ... Done!
Running order: 6 ... Done!
Running order: 7 ... Done!
Running order: 8 ... Done!
Running order: 9 ... Done!
Running order: 10 ... Done!
Running order: 11 ... Done!
Running order: 12 ... Done!
Running order: 13 ... Done!
Running order: 14 ... Done!
Running order: 15 ... Done!
Running order: 16 ... Done!
Running order: 17 ... Done!
Running order: 18 ... Done!
Running order: 19 ... Done!
Running order: 20 ... Done!
1	2.246
2	2.225
3	2.237
4	2.079
5	1.821
6	1.733
7	1.717
8	1.708
9	1.717
10	1.712
11	1.717
12	1.721
13	1.725
14	1.729
15	1.733
16	1.738
17	1.742
18	1.746
19	1.75
20	1.754
In the Figure is represented the plot for the execution above.